The Most Popular Color for Cars By State Compare to National Average
March 14, 2017
The color of your car could be saying things about you that you didn’t even know about yourself. For example, did you know that a black car says you are powerful, but have a touch of elegance? If yellow has caught your eye it may mean deep inside you are joyful and have a great sense of humor. Sometimes our color choices may be out of our hands. Like getting that great deal with our much anticipated tax returns or it may just be a sense of practicality….who wants to wash a white car every day when grey hides so much!
There is a huge chasm of choices. An article by iseecars in February of 2017 noted that 30.9% of Texans preferred brown pick-up trucks over any other choice on the market. With a population of 26.96 million in 2014 that may say a lot about the state and how they live and work. From 12 lanes of big city concrete roads in Austin and Dallas, to one lane dirt by-ways in Rice and Waco there is a special love of durability, practicality and especially heart in what working Texans prefer when it comes to their modern transportation.
Arizona’s choice is yellow which may show how a bright color is important to keep their vehicles cool during their brutal summers.
Here’s the full list:
| State | Color | % Over National Preference |
| AK | blue | 37.1% |
| AL | beige | 48.2% |
| AR | white | 29.4% |
| AZ | yellow | 38.7% |
| CA | gray | 24.8% |
| CO | gold | 50.8% |
| CT | green | 35.8% |
| DE | green | 39.8% |
| FL | beige | 36.2% |
| GA | gold | 17.0% |
| HI | silver | 32.0% |
| IA | red | 32.7% |
| ID | green | 33.0% |
| IL | black | 11.3% |
| IN | orange | 41.1% |
| KS | red | 20.9% |
| KY | beige | 37.7% |
| LA | brown | 36.8% |
| MA | brown | 52.3% |
| MD | blue | 22.2% |
| ME | green | 74.1% |
| MI | red | 17.8% |
| MN | red | 14.2% |
| MO | red | 20.5% |
| MS | white | 33.4% |
| MT | green | 70.1% |
| NC | white | 6.3% |
| ND | red | 31.3% |
| NE | red | 37.8% |
| NH | green | 70.7% |
| NJ | black | 19.7% |
| NM | gold | 49.1% |
| NV | gold | 36.0% |
| NY | gray | 31.5% |
| OH | orange | 32.4% |
| OK | red | 24.0% |
| OR | green | 41.6% |
| PA | green | 35.2% |
| RI | gray | 19.5% |
| SC | gold | 38.8% |
| SD | red | 30.6% |
| TN | beige | 25.4% |
| TX | brown | 30.9% |
| UT | white | 14.9% |
| VA | green | 25.9% |
| VT | green | 126.7% |
| WA | green | 38.2% |
| WI | red | 28.8% |
| WV | red | 45.9% |
| WY | red | 22.1% |
So, the next time you go looking for that next 4 wheeled family member, you may want to take a moment to look around and see what really catches your eye.
Quick Money Savings Tip For Safe Drivers
There are dozens of auto insurers – Which one will give you the best rate?
Step 1) Choose your vehicle make below.
Step 2) On the next page, complete the 4 minute questionnaire, and you'll have the opportunity compare the best rates in your area.
Step 3) Keep more money and possibly save hundreds!
2 Replies to “The Most Popular Color for Cars By State Compare to National Average”
Leave a Reply
Recent Articles
 Reasons Why You Shouldn’t Buy Your Used Car Off of Craigslist
 Wash Your Own Car And Save
 3 Maintenance Tips To Be A Fuel Efficient Driver
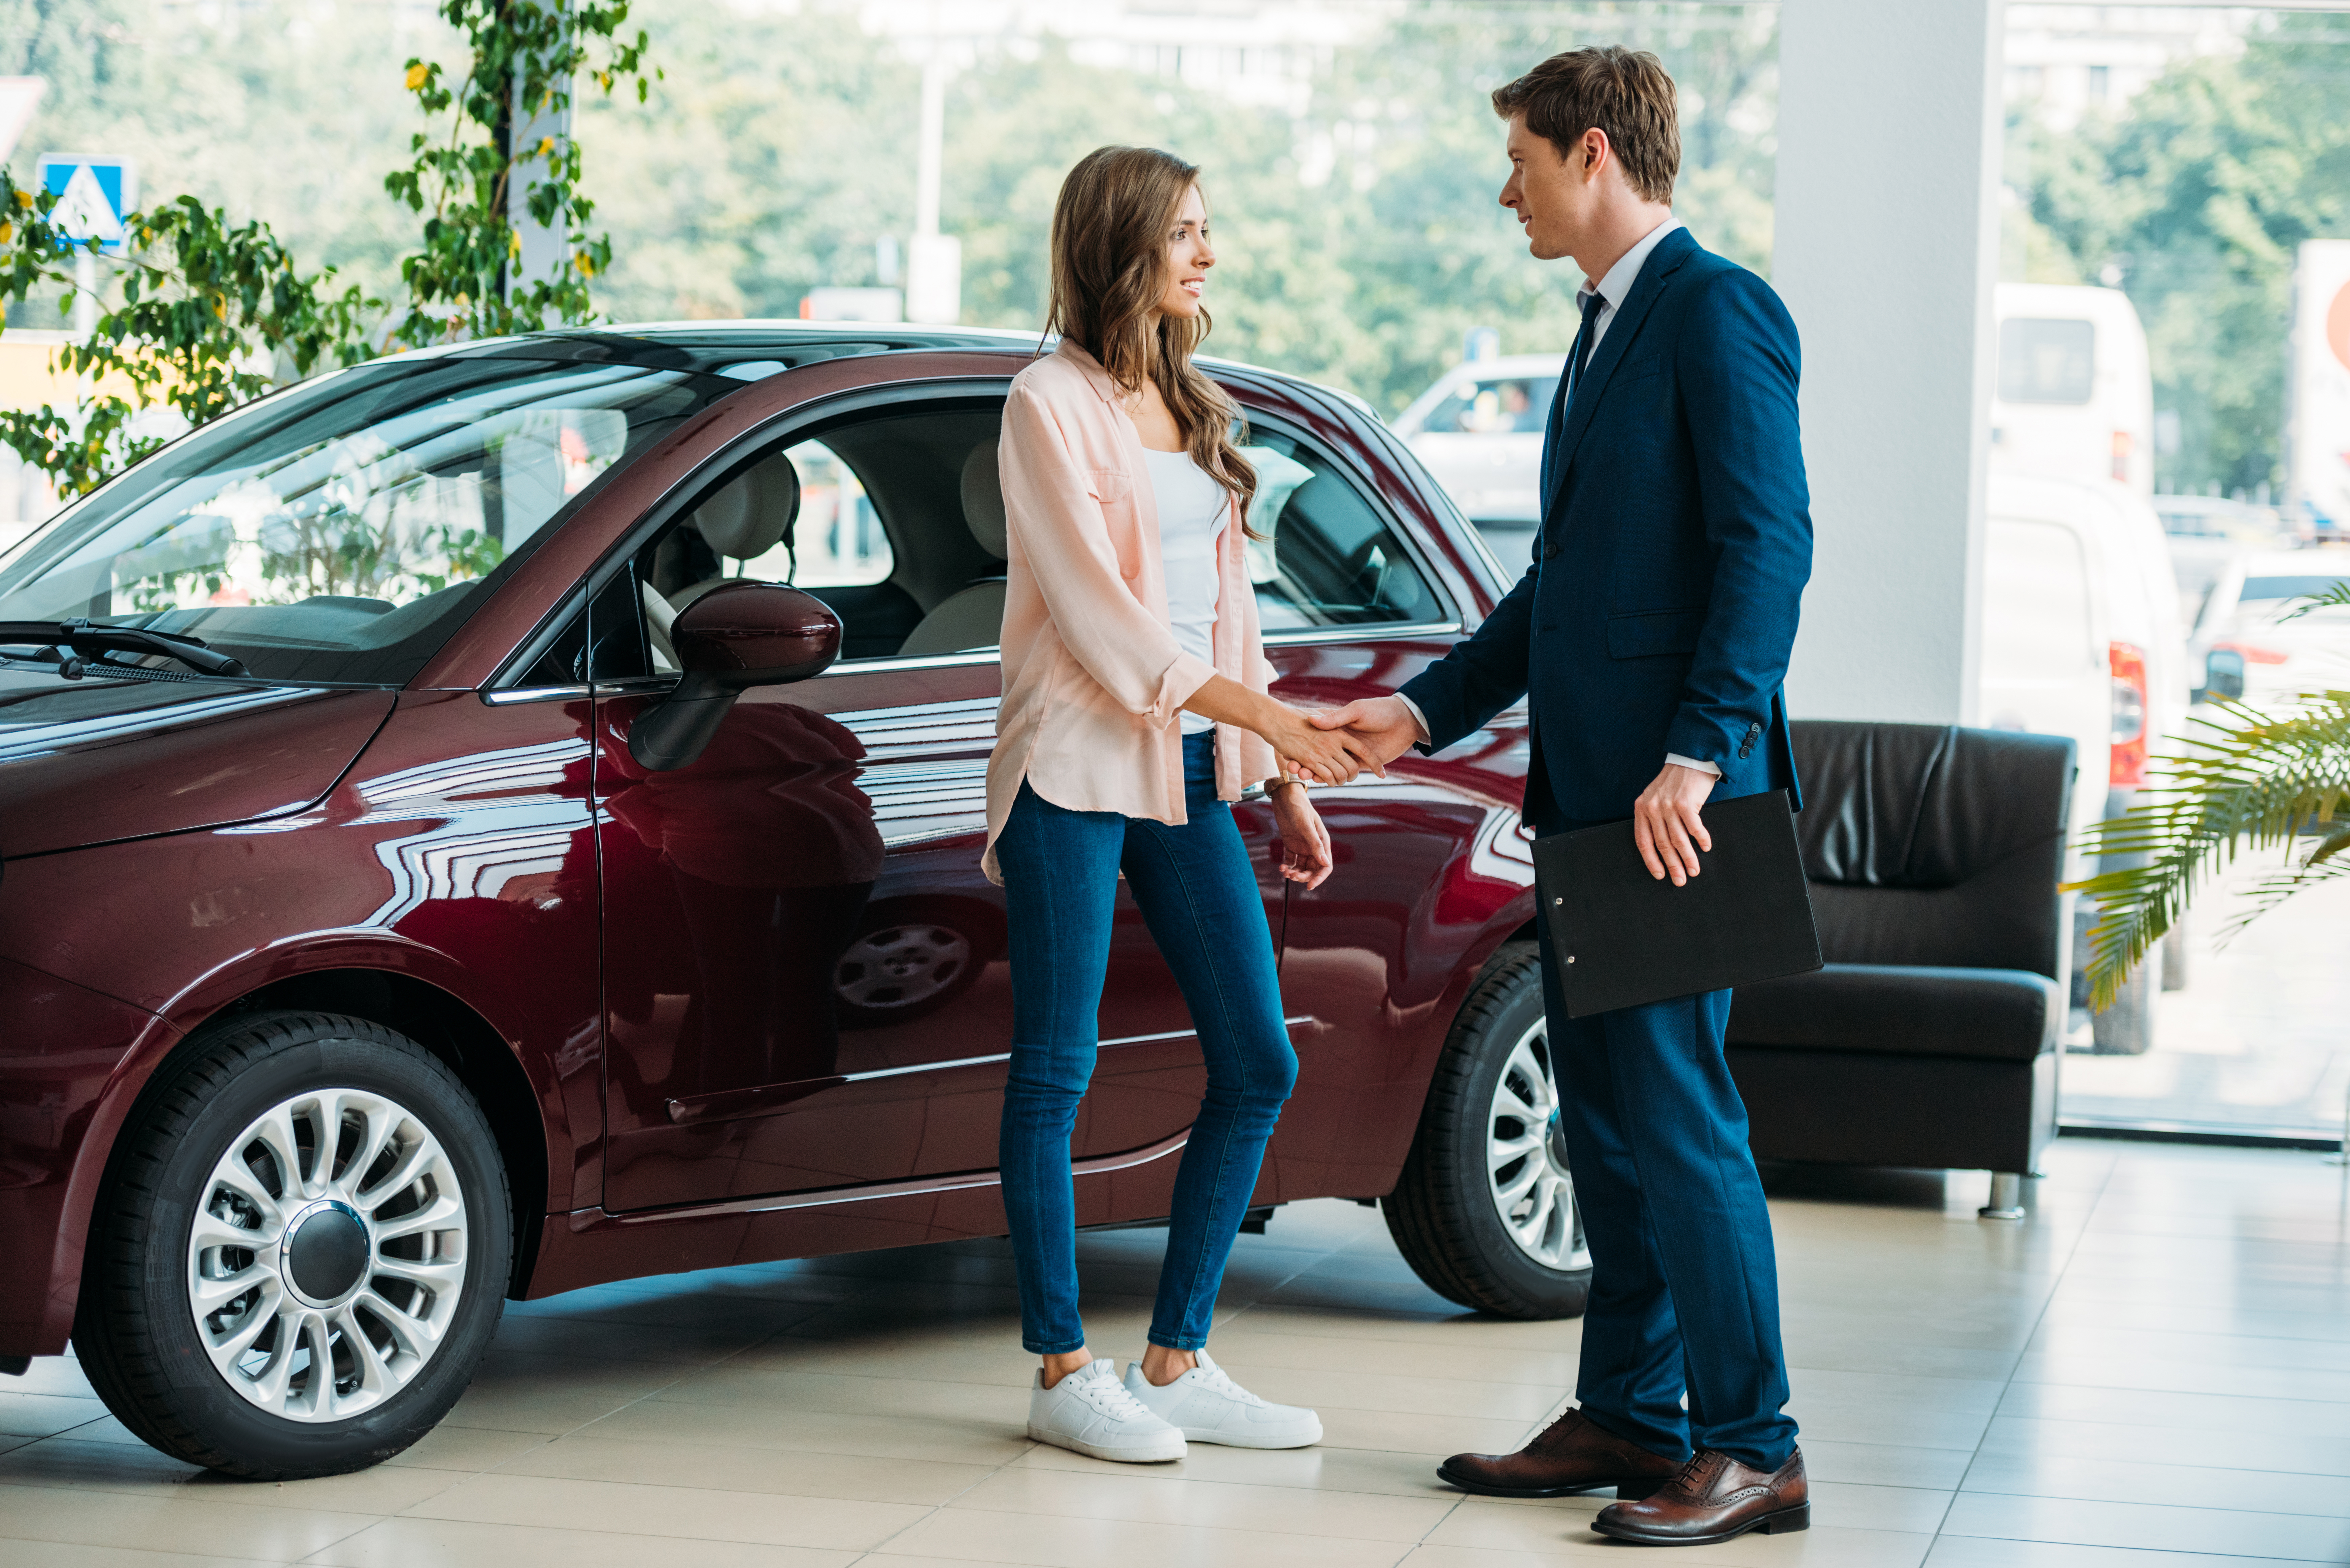 3 Tips On How To Be A Successful Car Buyer
 5 Tips You Need For Your Next Road Trip
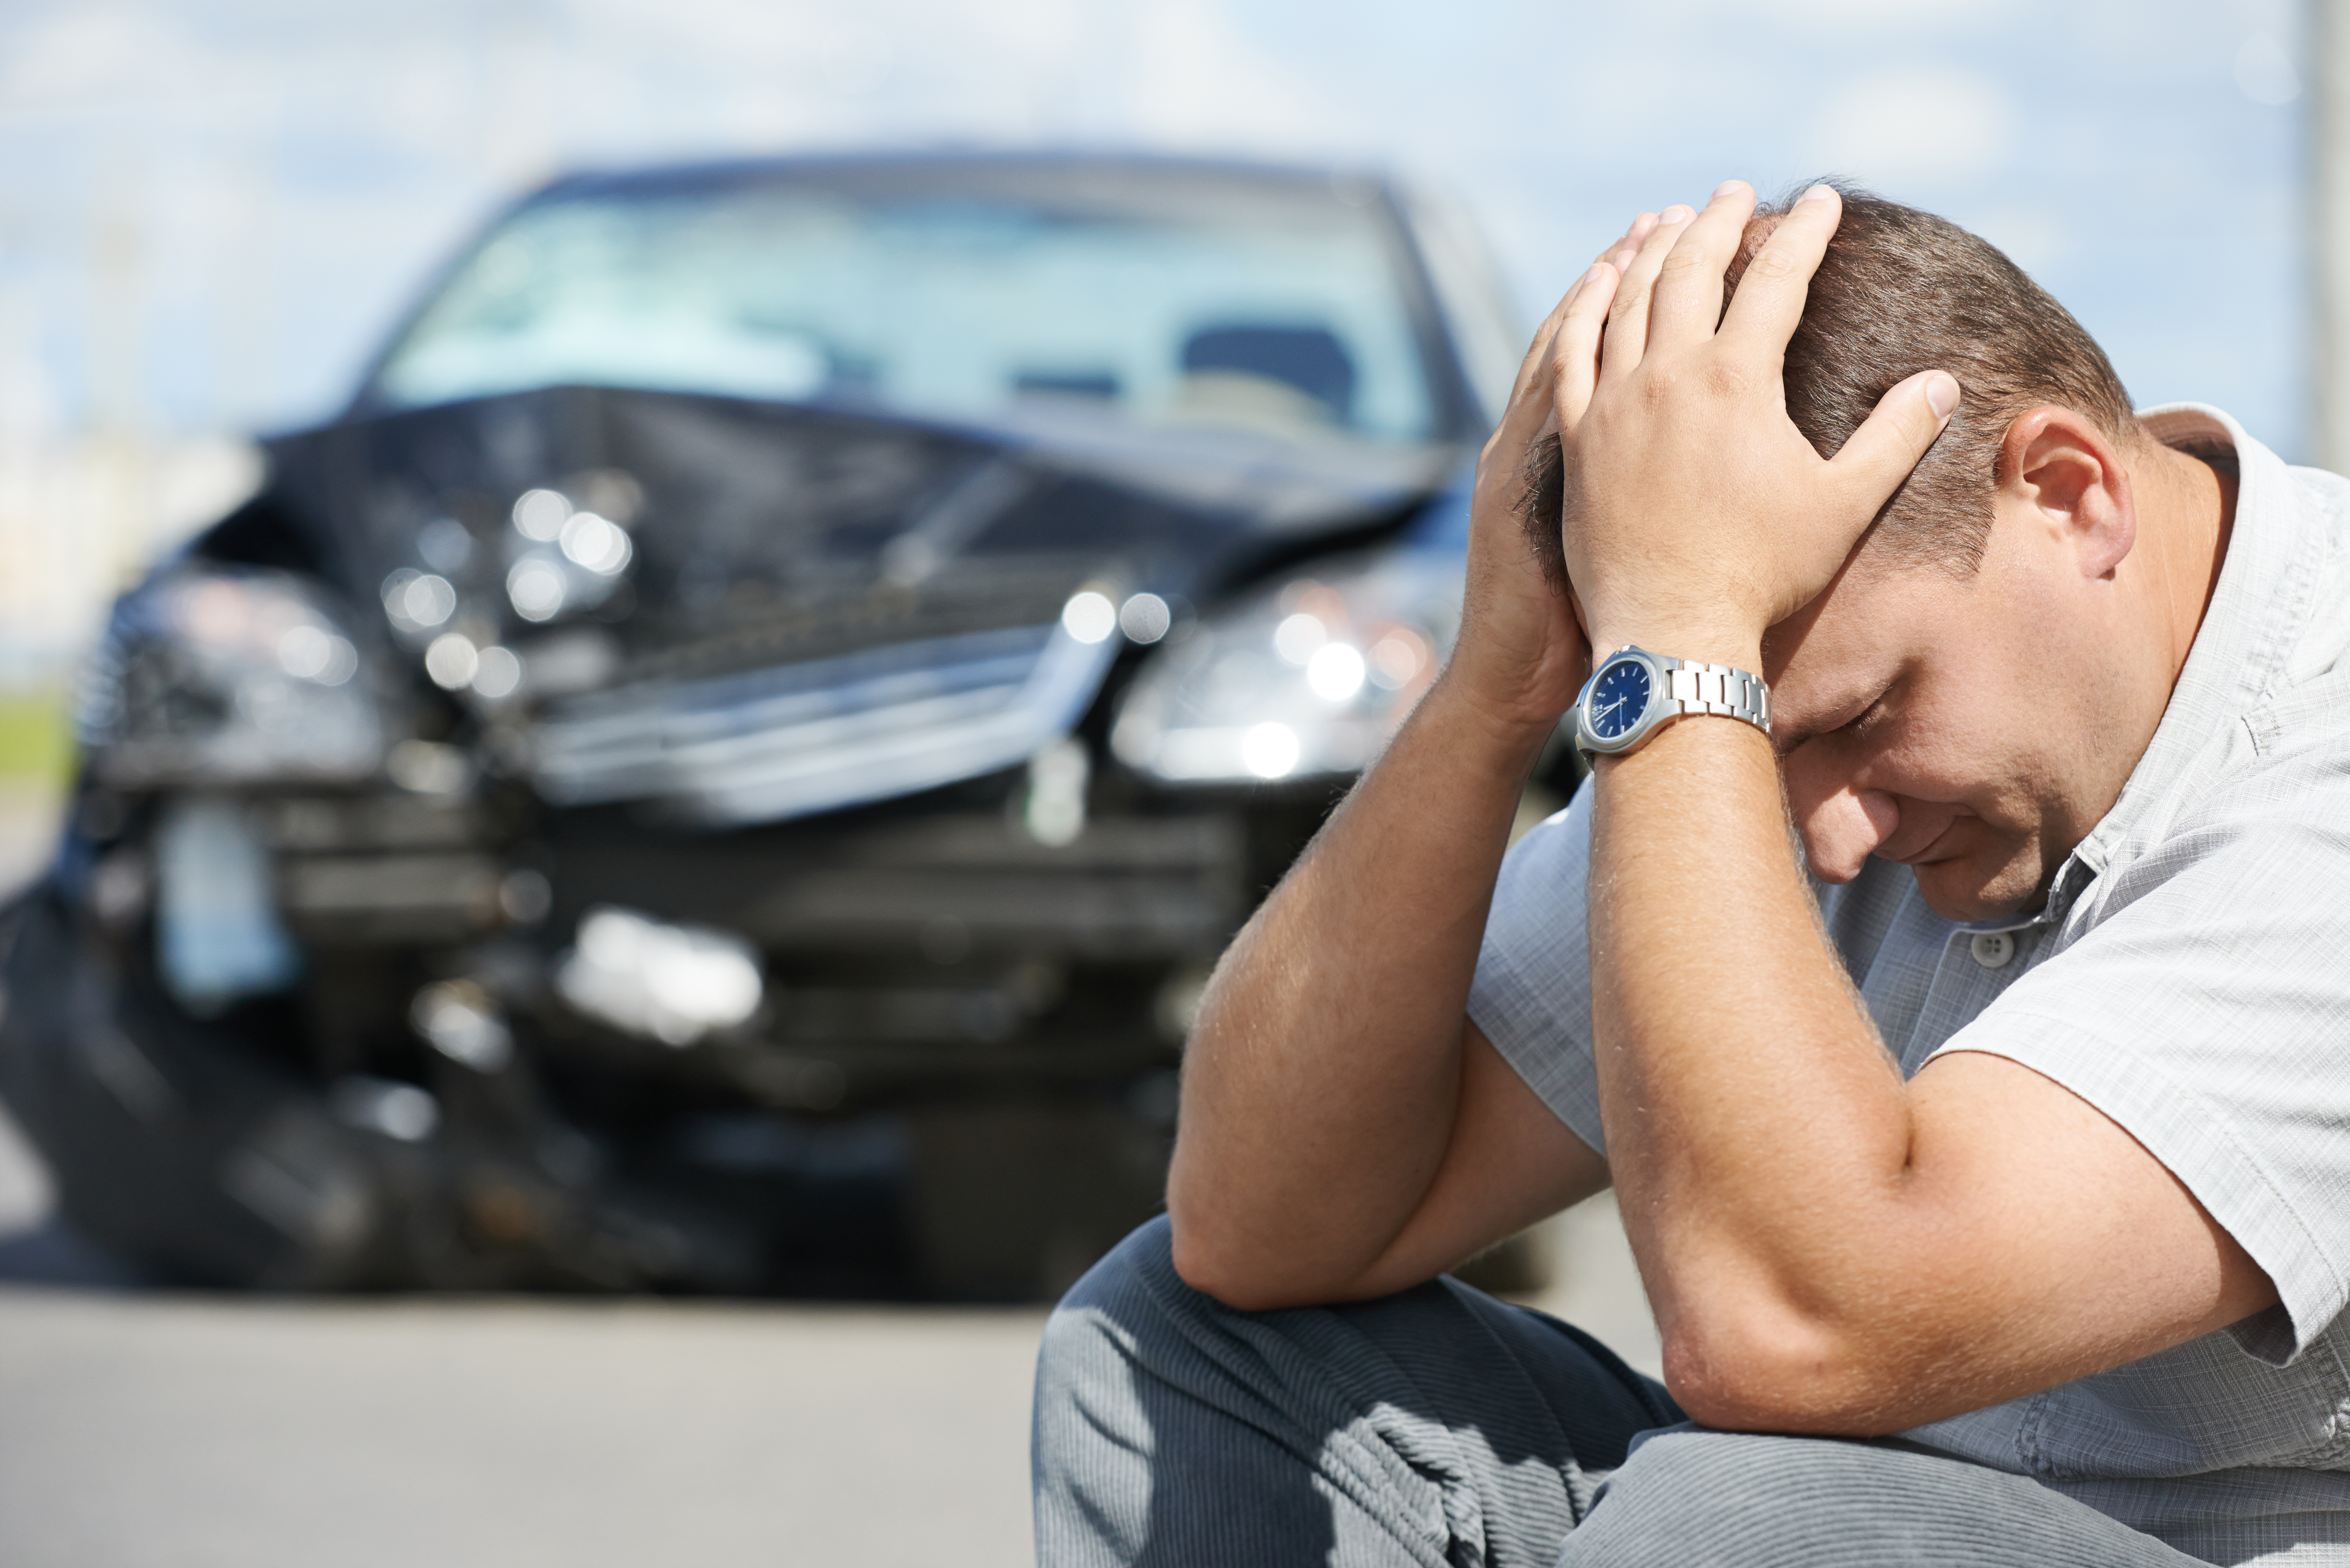 What Do I Do After A Car Accident?
 5 Tips To Paying Your Car Payment Off Early
 5 Questions To Ask When Looking For Your Perfect Car
 Oils You Need To Change In Your Car
 Best Apps To Find Cheap Gas Near You
What are things I can do to be a low risk driver. Looking around for a good insurance company that does not want to rip me off
We have a lot more details, if you read this article: http://www.discountdrivers.com/no-tickets/